Industrial inspection is changing as companies seek safer, faster, and more precise ways to assess critical assets. Refineries, power stations, bridges, and solar farms often contain elevated structures that are difficult to reach. An infrared drone can capture thermal and visual data from these areas without placing inspectors directly beside heat, height, or moving equipment. It may reveal overheated electrical connections, damaged insulation, blocked solar cells, and unusual heat patterns. No ladder is needed. Less disruption follows.
The strongest inspections combine drone imagery with experienced human judgment. A trained pilot must plan safe flight paths, control distance, and account for wind, reflections, and changing temperatures. An infrared camera also requires proper calibration. A bright metal surface may appear unusually cold, while sunlight can create misleading thermal contrasts. Results can mislead. Therefore, inspectors should compare thermal images with visible photographs, maintenance records, and readings from trusted instruments. This evidence-based process supports more reliable decisions.
Choosing an infrared drone is not simply a technology purchase. It is an operational decision involving equipment quality, pilot competence, data management, and inspection objectives. Experienced teams define temperature thresholds before flying and document findings in clear reports. They also identify uncertainty instead of hiding it. That honesty matters. A drone can locate a possible defect, but qualified professionals must evaluate its severity and recommend appropriate action. Used carefully, this technology can reduce exposure, shorten inspection windows, and improve asset visibility while preserving a practical respect for its limitations.
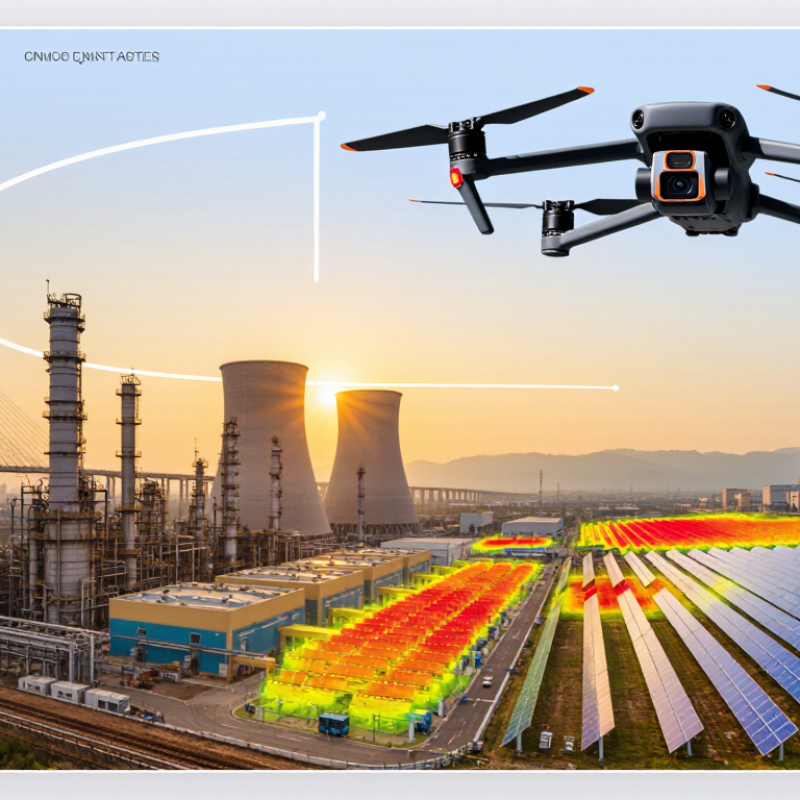
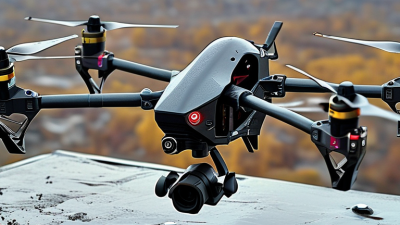
An infrared drone is an unmanned aircraft equipped with a thermal camera. It detects heat energy from surfaces and converts temperature differences into thermal images. Inspectors use these images to locate abnormal heating on power equipment, solar panels, roofs, tanks, and pipelines. A bright patch may indicate electrical resistance, insulation loss, friction, or moisture. It is a screening tool, not a magic window.
The U.S. Department of Energy’s Operations & Maintenance Best Practices guide reports that predictive maintenance can reduce maintenance costs by 8–12%. It may also reduce downtime by 35–45%. These figures cover predictive maintenance generally, not drones alone. The World Economic Forum’s Global Lighthouse Network reports productivity gains of 30–50% at some digitally enabled industrial sites. Infrared flights can support that approach by collecting visual evidence without placing workers near difficult areas.
Reliable inspection requires more than pressing “record.” Inspectors should check camera calibration, surface emissivity, wind, sunlight, and reflective materials. A shiny metal surface can mirror the sky and create a false temperature pattern. Thermal images should be compared with previous flights and confirmed using electrical tests or contact measurements. A neat image is not proof. This remains a weakness. Flight logs, weather records, and clear defect thresholds improve traceability, while standards such as ASTM E1934 help structure infrared examination.
Infrared drones capture thermal information that ordinary cameras cannot see. The chart below shows common electromagnetic wavelength bands and highlights the long-wave infrared range widely used for non-contact temperature mapping in industrial inspections.
Key insight: Long-wave infrared cameras operate mainly within the 8–14 µm atmospheric window, making them suitable for detecting temperature differences across electrical equipment, solar panels, roofs, pipelines, and other industrial assets while the drone remains at a safe distance.
Why Choose an Infrared Drone for Industrial Inspection?
How Infrared Sensors Detect Industrial Problems
Infrared sensors measure thermal radiation from surfaces, rather than visible light. Every machine component releases heat in a different pattern. A drone-mounted sensor records these patterns while flying above roofs, pipelines, electrical equipment, and storage areas. Hot spots may reveal overloaded connections, damaged insulation, blocked vents, or failing bearings before visible damage appears.
The sensor converts infrared energy into temperature data. Software then displays differences as colored areas on a thermal image. A loose electrical connection may appear as a small bright patch beside cooler cables. Moisture under roofing can create an uneven, cooler shape. These details help inspectors focus on precise locations instead of checking every surface manually.
Accurate inspection requires more than a colorful image. Surface material, sunlight, wind, distance, and camera angle can affect readings. A reflective metal panel may produce misleading results. That assumption can fail.
Experienced inspectors compare thermal images with visible photographs and maintenance records. They also measure the same area again when conditions change. In field work, I have found that a clear temperature difference deserves investigation, not immediate judgment. Calibration matters. So does careful documentation.
Infrared drones reduce climbing, improve coverage, and capture evidence from difficult areas. Yet they do not replace engineering expertise. A thermal anomaly is a warning sign, not a final diagnosis. Reliable decisions come from sensor data, site knowledge, and physical verification.
| Inspection Dimension | Infrared Measurement or Capability | Industrial Problems Detected | Why a Drone Is Useful | Important Limitations |
|---|---|---|---|---|
| Long-Wave Infrared (LWIR) | Typically detects thermal radiation in the 8–14 µm atmospheric window and produces a surface-temperature map. | Overheated electrical connections, insulation defects, blocked heat exchangers, bearing friction, and uneven heat distribution. | Enables rapid, non-contact scanning of large or elevated assets without placing personnel on structures. | It measures apparent surface temperature; reflective metal, wind, sunlight, and incorrect emissivity settings can affect accuracy. |
| Mid-Wave Infrared (MWIR) | Typically operates in the 3–5 µm range and can support high-temperature measurements and specialized gas-imaging applications. | High-temperature equipment anomalies, combustion-related conditions, and selected hydrocarbon-gas leaks when the sensor is designed for optical gas imaging. | Provides access to hot, hazardous, or difficult-to-reach areas while reducing exposure to heat and chemicals. | Gas detection requires a suitable spectral filter and sufficient gas concentration, path length, temperature contrast, and atmospheric conditions. |
| Near-Infrared (NIR) | Approximately 0.75–1.4 µm; records reflected infrared light rather than thermal emission. | Surface condition, vegetation stress near utilities, illumination-assisted visual inspection, and selected material differences. | Adds high-detail visual information that can be combined with thermal imagery for better asset context. | Requires reflected light and does not directly measure temperature; results vary with lighting, shadows, and surface reflectance. |
| Short-Wave Infrared (SWIR) | Approximately 1.4–3.0 µm; primarily measures reflected radiation and can reveal differences in moisture or material response. | Moisture intrusion, coating or material variation, some process-monitoring conditions, and selected hot-object inspections. | Can provide spectral information that complements ordinary visual and thermal cameras during broad-area surveys. | It is not a general-purpose thermal camera; performance depends strongly on illumination, atmospheric absorption, and sensor configuration. |
| Temperature Anomaly Mapping | Compares measured temperature patterns across similar components or against a reference condition. | Loose electrical joints, overloaded circuits, failed cooling paths, friction, bearing deterioration, and abnormal process heat. | Automated flight paths and geotagged images make repeated inspections easier to compare over time. | A temperature difference is an indicator, not a diagnosis; electrical load, operating state, and environmental conditions must be recorded. |
| Electrical Infrastructure | Thermal sensors identify localized hot spots and uneven heating on conductors, connectors, transformers, and switchgear. | High-resistance connections, phase imbalance, excessive load, damaged components, and cooling problems. | Allows inspection near energized equipment while keeping the operator away from many physical hazards. | The equipment should be under a representative operating load; thermal readings cannot replace electrical testing or isolation procedures. |
| Solar and Renewable Assets | Thermal imaging highlights temperature differences between photovoltaic cells, modules, connectors, and surrounding surfaces. | Hot cells, bypass-diode issues, interconnect faults, shading effects, damaged modules, and connector heating. | Large arrays can be surveyed quickly with consistent flight lines and location-tagged anomaly records. | Irradiance, wind, cloud cover, viewing angle, reflections, and module operating conditions influence the thermal pattern. |
| Mechanical Equipment | Detects abnormal heat distribution caused by friction, poor lubrication, misalignment, or restricted cooling. | Bearing wear, belt or coupling problems, overheating motors, pumps, fans, compressors, and rotating machinery. | Captures operating equipment from a safe distance and reduces the need for scaffolding or manual access. | Thermal imaging may not reveal defects that have not produced a measurable surface-temperature change. |
| Roofs, Facades, and Pipelines | Maps surface temperature variations associated with moisture, insulation differences, heat loss, or abnormal process conditions. | Wet insulation, missing insulation, roof moisture patterns, pipeline heat loss, and selected coating or surface defects. | Aerial coverage provides consistent views of extensive or elevated surfaces with fewer access arrangements. | Thermal patterns can be ambiguous; confirmation may require visual inspection, moisture meters, ultrasonic testing, or other methods. |
| Inspection Efficiency | Combines radiometric images, visible-light photos, coordinates, timestamps, and repeatable flight paths. | Delayed detection, incomplete coverage, inconsistent manual observations, and weak historical comparison. | Reduces work at height, limits production interruption, and supports trend analysis across repeated inspections. | Flight permissions, weather, battery endurance, electromagnetic conditions, data quality, and operator training must be managed. |
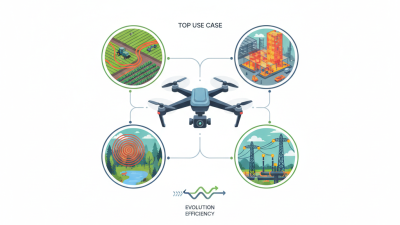
Infrared drones can inspect large industrial assets without placing technicians on roofs, towers, or live electrical areas. Their thermal cameras reveal abnormal heat patterns, while RGB images show cracks, corrosion, loose fittings, and surface damage. IRENA’s Renewable Capacity Statistics 2024 recorded 1,419 gigawatts of global solar capacity at the end of 2023. That scale makes aerial thermal screening valuable for solar farms, panels, inverters, transformers, and battery enclosures.
Wind infrastructure is another strong application. The Global Wind Energy Council reported 117 gigawatts of new wind capacity installed in 2023. Infrared drones can examine turbine blades, nacelles, generators, brake systems, and electrical cabinets. They also support inspections of transmission lines, substations, cooling towers, storage tanks, pipelines, industrial roofs, and flare structures. Hot connectors often appear as small bright points before equipment failure becomes visible.
Thermal data is not magic. A reflective metal roof can create misleading readings, especially under changing sunlight. Wind, rain, dust, and poor camera angles also reduce confidence. Inspectors should combine thermal images with weather records, visual evidence, maintenance history, and repeat flights. The International Energy Agency’s Electricity Grids and Secure Energy Transitions report estimates that global grid investment must more than double by 2030. More assets require better prioritization, not simply more images. Human review remains essential.
Infrared drone inspections turn heat into practical maintenance evidence. A thermal camera can reveal overheated bearings, loose electrical connections, blocked solar panels, and uneven insulation without direct contact. Heat leaves clues. This helps crews examine roofs, towers, substations, and storage areas while limiting climbing and shutdown exposure. The U.S. Department of Energy’s Industrial Decarbonization Roadmap reports that industry consumes about 30% of U.S. energy, so small efficiency losses can become expensive quickly.
The benefits are strongest when thermal data supports a wider inspection program. Drone Industry Insights’ Drone Market Report identifies inspection and maintenance as major commercial drone applications. McKinsey Global Institute has reported that predictive maintenance can reduce machine downtime by 30–50%. Infrared flights may help teams find abnormal heat before visible damage appears. They also create repeatable images for comparing the same asset over time. Standards such as ASTM E1934 and ISO 18436-7 support disciplined thermography practices.
Still, thermal images are not magic. Wind, sunlight, emissivity, moisture, and reflective metal can distort readings. A cool surface may hide internal damage. Operators should combine radiometric images with visual checks, electrical measurements, and equipment history. That extra step is easy to skip. It should not be. A credible inspection records weather, distance, camera settings, temperature differences, and follow-up actions. Otherwise, a colorful image can look convincing while offering weak evidence.
An infrared drone inspection begins with a clear question: what failure are we trying to detect? Define the asset, inspection zone, temperature range, and reporting requirements. Review site hazards, flight permissions, weather, and emergency procedures before deployment. Wind, rain, reflective surfaces, and recent maintenance can distort thermal readings.
Use a calibrated infrared sensor and confirm its settings on the ground. Record ambient temperature, humidity, and surface conditions. Plan overlapping flight paths around roofs, power equipment, pipelines, or storage structures. Keep a safe distance from people and obstacles. A trained operator should monitor the live feed while another specialist checks the asset history and visible imagery.
Fly steadily.
Capture thermal and visual images from matching angles. Look for unusual heat patterns, not isolated colors. A bright area may indicate friction, electrical resistance, sunlight reflection, or a harmless surface difference. Compare findings with nearby components and previous inspection data. Ground verification remains important when access is safe and permitted.
A clean image can still mislead. Field teams may miss a defect when the flight is rushed or the sensor is poorly focused. I would rather repeat one doubtful pass than label a normal variation as damage. Store original files securely, document every assumption, and separate measured evidence from professional judgment. Reports should show image location, temperature readings, inspection limits, and recommended follow-up actions.